Solar panel cost va usually bundles equipment, installation labor, permits, inspections, and contractor overhead. It often does not include future roof repairs or optional batteries, so compare quotes with those items in mind.
The typical per‑watt rate in 2026 is about $3.02 per watt, close to the U.S. average of $3.03/W. Virginia solar pricing sits near national norms, but total project price grows when homes need larger systems due to higher energy use.
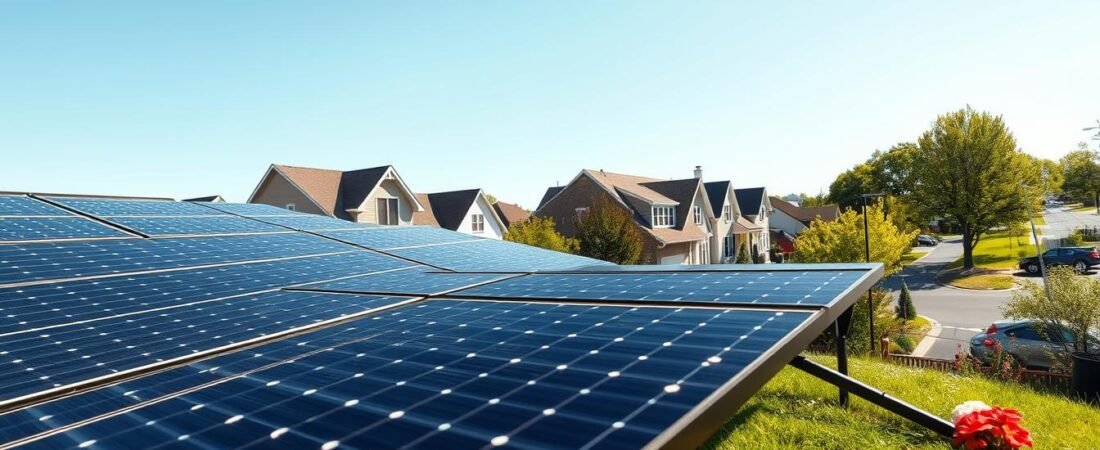
Homeowners should expect variation by system size, roof complexity, and installer. This guide covers sizing from your electric bill, choosing panels and inverters, adding batteries, and weighing incentives.
How to use this guide: start with current local per‑watt pricing, estimate your likely system size, then apply incentives and financing options to model out‑of‑pocket price and payback. Use the sample kW totals and payback examples to sanity‑check offers from companies.
This intro sets simple benchmarks so readers can compare offers and make choices that help them save money over time.
What Virginia homeowners are paying for solar right now
Installed price per watt is the quick metric buyers use to compare offers. It shows the total system price divided by system size, so you can compare different equipment tiers and installation scopes on an apples‑to‑apples basis.
Average installed price per watt in Virginia vs. the U.S.
Recent benchmarks put Virginia near the national mean: roughly $3.02 per watt in 2026 vs. a U.S. average of about $3.03/W. Earlier datasets (Dec 2024) reported slightly higher numbers — about $3.35/W for the state versus $3.33/W nationally — showing how timing and methodology shift results.
Typical total price ranges Virginians see before incentives
Translating per‑watt figures to total project bills gives buyers clearer expectations. Typical pre‑credit ranges cited for Virginia run roughly from the high‑$20,000s to the mid‑$40,000s depending on system size and equipment.
Why averages can look different across sources
Different assumed system sizes, equipment tiers, and whether numbers are pre‑ or post‑incentive cause variation. Also, many Virginia homes use more electricity, so they often need larger kW installs even when per‑watt prices match national levels.
Buyer takeaway: when you see an average figure online, ask what system size and assumptions it uses before you anchor to it. For local per‑watt benchmarks and data, check this resource: Virginia price data.
Solar panel cost VA by system size and what it means for your home
Choosing the right system size matters more than hunting a low per‑watt number. Total price rises with system kW, but larger installs often deliver a lower price per watt. That scale effect comes from equipment bundles and fewer hours of labor per added watt.
Smaller systems vs. larger systems
Small systems (4–6 kW) fit modest usage and cost less up front. They suit renters or homeowners who want partial offset.
Large systems (8–11+ kW) raise the total bill but usually lower the unit price. Bigger installs are common for homes with high monthly bills.
Sample pricing tiers (after federal credit)
| System size (kW) | Approx. after‑credit total |
|---|---|
| 4 kW | $10,220 |
| 6 kW | $15,000 |
| 8 kW | $18,500 |
| 10 kW | $19,600 |
How use and bill size guide sizing
An average household using more power may need 8–14 kW. For example, an 11 kW system often aligns with homes paying about $153/month, turning that bill into a reference for size.
Neighbors can end up with different quotes because of offset goals, roof layout, or production potential.
“Estimate your likely kW before you compare per‑watt offers — size is the bridge to an accurate quote.”
Decision takeaway: start by estimating needed kW. That makes the per‑watt averages meaningful and helps you judge if a quoted price is fair.
How to estimate your solar panel system price using your electric bill
Start by pulling a full year of energy use from your electric bill to get a reliable sizing baseline. That annual kWh total lets you convert usage into a rough kW system size for your home.
From kWh usage to kW sizing in Virginia
Take 12 months of kWh from the bill and add a small buffer for seasonal swings. Divide the annual kWh by expected yearly production per kW in your area to get an estimated system size.
Reality check: a common benchmark shows a roughly $153 monthly bill often aligns with about an 11 kW install for full offset. Higher electricity use in Virginia usually means a larger system, which can translate to greater long‑term savings if your roof supports it.
What to gather before requesting quotes
- Last 12 months of electric bills and average monthly kWh.
- Roof age, material, and photos of roof layout.
- Clear photos of your electric panel and meter.
- Note planned EV purchases and whether you want backup power.
- Decide your target offset (partial vs. full) and financing type.
Ask all companies to quote using the same assumptions. Good proposals include a production estimate (kWh), system size (kW), equipment list, warranty terms, and a clear breakdown of incentives and net price.
Key factors that move your solar costs up or down in Virginia
A handful of site-specific details often determine why two neighbors get very different quotes.
Permitting, inspections, and installer overhead
Local permit fees, inspections, and utility paperwork add non‑hardware charges to any estimate.
Installer overhead — licensing, insurance, and warranty support — also shows up in final prices.
Roof type, layout, shading, and electrical upgrades
Roof material matters: asphalt is quickest to work on, while tile or metal can slow crews and raise labor charges.
Steep pitch or many roof planes require more time and custom mounts, which increases the installation bill.
Tree shading or complex layouts may force panel placement tradeoffs or extra design work.
Electrical items like main panel upgrades, service changes, or adding breakers are common add‑ons.
Local labor pricing and market competition
Labor rates vary across the state. In busy markets, competition can lower quotes.
Get multiple bids from reputable companies to spot meaningful differences for similar equipment.
Weather resilience and ongoing maintenance
Virginia weather — strong storms and occasional tropical systems — leads some homeowners to choose higher-rated modules and stronger racking.
That premium gear costs more up front but can reduce damage risk and downtime.
Plan for rare ongoing costs: typical maintenance runs about $400 annually (range $300–$700).
Glass crack repairs can cost roughly $120–$500 per panel. Good warranties cut out-of-pocket exposure over time.
Buyer protection: Beware very low quotes; they may skip quality equipment, workmanship, or long-term business viability — crucial when warranties last 25+ years.
Equipment choices that affect solar panel prices and long-term value
Picking the right gear affects production, roof fit, and long-term returns. Start by matching module efficiency and inverter style to your roof and shade patterns. That approach helps you squeeze more energy from limited space and avoid upgrades later.
Monocrystalline vs. polycrystalline
Monocrystalline modules are more efficient and common for homes. They usually need fewer units to hit a target kW, so they suit small or obstructed roofs.
Polycrystalline units cost less but take more roof area. They can be fine where space isn’t tight and budget matters.
Higher-watt modules and tight roofs
Modern modules around ~450W can deliver more power per unit. That matters when dormers, setbacks, or shading limit usable area.
Inverter choices and roof layout
String inverters work well on uniform roofs. Microinverters or optimizers help when panels face different angles or some are shaded.
Batteries, outages, and budget impact
Adding storage increases upfront prices but adds outage protection and flexibility. Ensure batteries integrate cleanly with the inverter type you choose.
Warranties and long-term value
Look for product, performance, and workmanship coverage. Premium gear often has 25+ year warranties and slower degradation, which can boost lifetime energy and improve ROI despite higher initial money outlay.
Solar incentives in Virginia that reduce your out-of-pocket cost
Incentives can cut what you pay up front and improve long‑term returns. Below are the main programs Virginia homeowners should know about and how they work in plain language.
The 30% federal tax credit and how it’s claimed
The federal tax credit covers 30% of qualified system expenses, including equipment, labor, and certain permitting fees. You claim it on your federal return the year after installation.
This is a non‑refundable credit: it reduces your tax bill, not a direct cash rebate. If the credit exceeds taxes owed, you may carry the unused portion into future years per current IRS rules.
Virginia does not offer a state tax credit — what that means
Contrary to some listings, Virginia has no statewide solar tax credit. That means most tax‑credit savings come from the federal program and from local incentives or utility policies.
Check local rebates carefully; they vary by utility and county and are not guaranteed statewide.
Property tax exemption starting in 2024
Beginning in 2024, Chapter 496 to the Code of Virginia makes the property tax exemption for qualifying systems statewide.
Why that matters: your home can gain resale value from an installed system without raising property tax in many cases. Confirm local rules with your assessor.
Virginia SRECs, how earnings work, and why they’re taxable
SRECs are certificates generated based on production and sold to buyers or brokers. Prices and demand can change year to year, so earnings are variable.
Note: SREC proceeds are typically taxable income and often reported via 1099 if above reporting thresholds. Consult a tax professional to plan for potential tax filing impacts.
“Ask your installer to list incentives line‑by‑line, confirm eligibility, and keep copies of all documents for tax time.”
- Ask installers to show incentives and net price clearly.
- Verify local rebates before assuming availability.
- Keep receipts and production records for tax filings.
Net metering, utility rates, and how Virginia solar savings really pencil out
How your utility credits exported energy is often the biggest driver of lifetime savings.
Why full retail net metering matters
Net metering lets you export excess energy and receive bill credits. When the utility credits at full retail value, each exported kWh offsets what you would otherwise buy. That directly boosts savings and shortens the payback period.
How assumptions change payback estimates
Two quotes can use different net metering rules or production estimates and show very different payback figures. If one proposal assumes full retail net metering and another assumes reduced crediting, the years to breakeven can diverge sharply.
Rising electricity rates and ROI
Utilities have raised rates recently—many households saw bills climb about $15/month on average. When electricity prices rise, each kWh your system produces is worth more.
This makes lifetime savings larger and can cut the payback period by several years, assuming credits remain favorable.
“Model savings over years, not months, and verify how exported energy is credited.”
Red flags to watch for:
- Unrealistic production forecasts that ignore shading or roof tilt.
- Inflation assumptions for utility rates that are excessively high or low.
- Unclear treatment of net metering credits or monthly true-up rules.
Buyer tip: shift daytime loads (dishwashers, EV charging) to when the system produces or add a battery to increase self-consumption. That reduces reliance on exported credits and raises real-dollar savings.
| Scenario | Net metering credit | Typical effect on payback (years) |
|---|---|---|
| Full retail credit | 1.0 x retail kWh price | Shorter by 2–5 years |
| Reduced export credit | 0.25–0.75 x retail | Longer by 3–7 years |
| No net metering / buy-back only | Utility wholesale or fixed rate | May double payback years |
Is solar worth it in Virginia in 2026?
Deciding if rooftop generation makes sense in 2026 comes down to the payback period and the long‑term savings you expect to see. Look at the net installed price after incentives and compare that to the annual reduction in your electricity bills.
Realistic payback timing and a sample VA savings snapshot
Here’s a clear example using a cash purchase with full retail net metering:
- System size: 6.9 kW
- Estimated generation: ~9,326 kWh/year
- Gross cost: ~$20,838
- Net after federal credit: ~$14,587
- Payback: ~10.4 years
- Estimated avoided utility costs (25 years): ~$46,993
How savings change with system size, rates, and production
Payback varies because of system size, roof production, local rates, and how exported energy is credited. Buying with cash shortens breakeven versus financing. Larger systems can produce greater total savings but only if the home can use or receive fair credit for that energy.
Value goes beyond years to breakeven. Consider electricity price hedging, potential resale value boosts, and outage resilience with optional storage.
“Get 2–3 detailed quotes that use the same assumptions. If your roof is viable and your bill is meaningfully high, a purchase often makes financial sense.”
How to pay for solar in Virginia: cash, loan, lease, and PPA comparisons
Choose the payment path that matches your goals: minimize upfront money, maximize long‑term savings, or balance monthly budgets with ownership perks. Below is a clear, decision‑first view of the four main options and what each means for ownership, incentives, and resale.
Cash purchase and why it usually delivers the best ROI
Paying cash removes interest charges and gives you full access to the federal tax credit and other incentives tied to ownership. That means higher lifetime savings and faster payback.
Cash also simplifies resale: the buyer gets an owned system with full warranties and incentives already claimed by the seller or transferrable value in appraisals.
Loans: APR, term length, and true total price
Loans let you buy now and pay over time. Interest rates vary widely—roughly 2%–20% APR depending on credit, loan type, and lender.
Watch the term: longer loans lower the monthly payment but raise total paid. Ask for an amortization schedule so you can compare total dollars paid vs. cash.
Leases and power purchase agreements (PPAs)
Leases and power purchase agreements cut or eliminate upfront charges but keep ownership with the company. That usually means lower savings and limited access to tax credits and some incentives.
Contracts may include annual escalators and transfer rules that complicate selling your home. Get full contract terms and escalation examples in writing before signing.
PACE and low‑to‑moderate income programs to ask about
PACE financing can cover a large share of price and tie repayment to property tax bills where available.
Also ask about state and local low‑to‑moderate income loan or rebate programs that reduce barriers for qualifying households.
| Payment path | Upfront money | Who owns | Who gets tax credit |
|---|---|---|---|
| Cash purchase | High | Owner | Buyer (full) |
| Loan | Low–Medium | Owner | Buyer (full) |
| Lease | Very low | Company | Company |
| PPA | Very low | Company | Company |
| PACE / LMI programs | Varies | Owner (often) | Buyer (if owner) |
Quote checklist: request a cash price and financed price, ask for a full loan amortization, get lease/PPA sample contracts and escalator examples, and confirm who claims incentives.
For more financing details and state comparisons, review a local pricing resource here: Virginia pricing and financing guide.
Conclusion
Conclusion
A smart purchase starts with clear numbers: pull a year of electric bills, estimate a realistic system size, and use per‑watt benchmarks (about $3.02/W in 2026) to compare offers.
Remember the big levers: the 30% federal tax credit and the statewide property tax exemption that began in 2024. SREC income may be taxable, so plan with a tax adviser.
Choose equipment that fits your roof, confirm warranties, and vet installer reputation. Typical payback examples land near 10–12 years depending on assumptions.
Get 2–3 local evaluations, bring your bills, and ask for line‑item proposals showing net price, estimated generation, and installation warranties. With the right assumptions and a trusted installer, solar panels and the supporting system can help stabilize long‑term energy bills.